Excel Pivot Table. The Pivot Table is a powerful built-in special tool in MS Office Excel. The Pivot Table is an object. It is a member of Pivot Tables collection. It consists of rows, columns and data fields.
The pivot table helps to analyse large amounts of data sets and quickly summarize data using aggregate functions. The aggregate functions are sum, Average, Count, Maximum, Minimum, Median, Mode, etc. We also apply a filter to the pivot table to view required summarized data, create reports and key insights. It helps the team or higher-level management to take decisions in the organisations. We create Pivot Table from Range or Table or External Data Source, or Data Model.
Excel Create Pivot Table
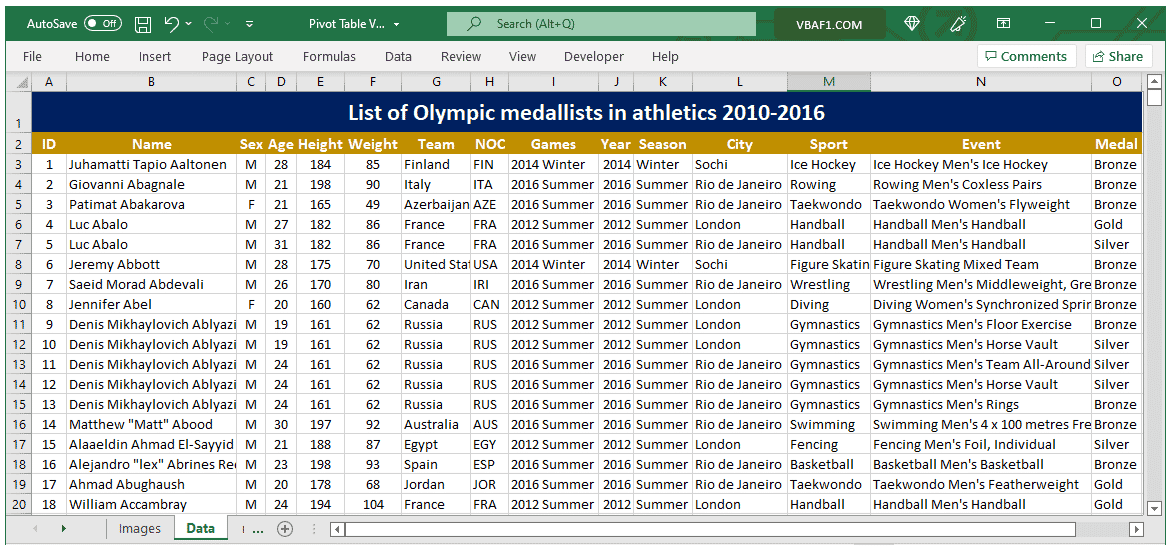
Let us see how to create the Pivot Table in Excel. I have taken a List of Olympic medalists in athletics 2010-2016 data to create a Pivot Table to Data Sheet. I want to know how many male and female athletes participated in different sports for the year 2010. Let’s create a summarized data report using Pivot Table. Here is the following screenshot of the data.

Here are the step-by-step instructions and screenshots:
- Open Excel Workbook.
- Select any cell inside the dataset or Select data from the Data sheet.
- Go to Insert tab.
- Click on the Pivot Table from the Tables Group.
- The Following dialog box appears on the screen.
- You can choose either New Worksheet or Existing Worksheet as shown above. Default creates Pivot Table on the New Worksheet. Otherwise select location in the existing worksheet. I choose New Worksheet here.
- Pivot Table created in the new Worksheet named as “Sheet5” as shown in the below picture.
- Now drag and drop required fields to areas as shown and highlighted in below screenshot. I choose Year field as a filter area, Sex field as column, Sport field as Row, and Count of medals as Values. You can see the final Pivot table in the left-hand side.
- The Maximum number of athletes played the “Ice Hockey” game, and the Skeleton played a smaller number of athletics during the year 2010.
- This is how we create a Pivot Table in Excel.


Pivot Table:
Let’s see complete tutorial of the Pivot table.
Other Useful Resources:
Click on the following links of the useful resources. These helps to learn and gain more knowledge.
VBA Tutorial VBA Functions List VBA Arrays VBA Text Files VBA Tables
VBA Editor Keyboard Shortcut Keys List VBA Interview Questions & Answers Blog


